You can run this notebook in a live session or view it on Github.
GRIB Data Example#
GRIB format is commonly used to disseminate atmospheric model data. With xarray and the cfgrib engine, GRIB data can easily be analyzed and visualized.
[1]:
import xarray as xr
import matplotlib.pyplot as plt
To read GRIB data, you can use xarray.load_dataset
. The only extra code you need is to specify the engine as cfgrib
.
[2]:
ds = xr.tutorial.load_dataset("era5-2mt-2019-03-uk.grib", engine="cfgrib")
---------------------------------------------------------------------------
ValueError Traceback (most recent call last)
Cell In[2], line 1
----> 1 ds = xr.tutorial.load_dataset("era5-2mt-2019-03-uk.grib", engine="cfgrib")
File ~/checkouts/readthedocs.org/user_builds/xray/checkouts/latest/xarray/tutorial.py:206, in load_dataset(*args, **kwargs)
169 def load_dataset(*args, **kwargs) -> Dataset:
170 """
171 Open, load into memory, and close a dataset from the online repository
172 (requires internet).
(...)
204 load_dataset
205 """
--> 206 with open_dataset(*args, **kwargs) as ds:
207 return ds.load()
File ~/checkouts/readthedocs.org/user_builds/xray/checkouts/latest/xarray/tutorial.py:161, in open_dataset(name, cache, cache_dir, engine, **kws)
159 # retrieve the file
160 filepath = pooch.retrieve(url=url, known_hash=None, path=cache_dir)
--> 161 ds = _open_dataset(filepath, engine=engine, **kws)
162 if not cache:
163 ds = ds.load()
File ~/checkouts/readthedocs.org/user_builds/xray/checkouts/latest/xarray/backends/api.py:552, in open_dataset(filename_or_obj, engine, chunks, cache, decode_cf, mask_and_scale, decode_times, decode_timedelta, use_cftime, concat_characters, decode_coords, drop_variables, inline_array, chunked_array_type, from_array_kwargs, backend_kwargs, **kwargs)
549 if from_array_kwargs is None:
550 from_array_kwargs = {}
--> 552 backend = plugins.get_backend(engine)
554 decoders = _resolve_decoders_kwargs(
555 decode_cf,
556 open_backend_dataset_parameters=backend.open_dataset_parameters,
(...)
562 decode_coords=decode_coords,
563 )
565 overwrite_encoded_chunks = kwargs.pop("overwrite_encoded_chunks", None)
File ~/checkouts/readthedocs.org/user_builds/xray/checkouts/latest/xarray/backends/plugins.py:205, in get_backend(engine)
203 engines = list_engines()
204 if engine not in engines:
--> 205 raise ValueError(
206 f"unrecognized engine {engine} must be one of: {list(engines)}"
207 )
208 backend = engines[engine]
209 elif isinstance(engine, type) and issubclass(engine, BackendEntrypoint):
ValueError: unrecognized engine cfgrib must be one of: ['netcdf4', 'h5netcdf', 'scipy', 'store', 'zarr']
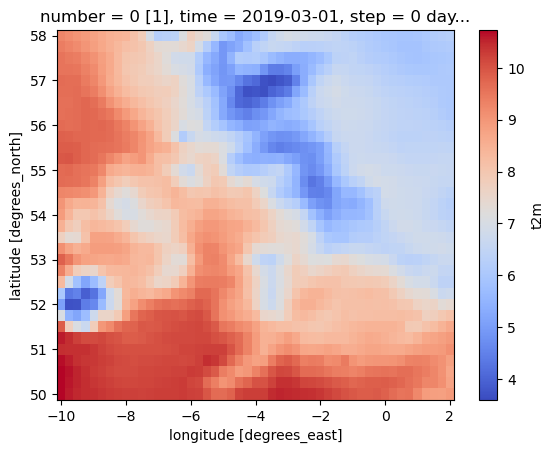
Let’s create a simple plot of 2-m air temperature in degrees Celsius:
[3]:
ds = ds - 273.15
ds.t2m[0].plot(cmap=plt.cm.coolwarm)
---------------------------------------------------------------------------
NameError Traceback (most recent call last)
Cell In[3], line 1
----> 1 ds = ds - 273.15
2 ds.t2m[0].plot(cmap=plt.cm.coolwarm)
NameError: name 'ds' is not defined
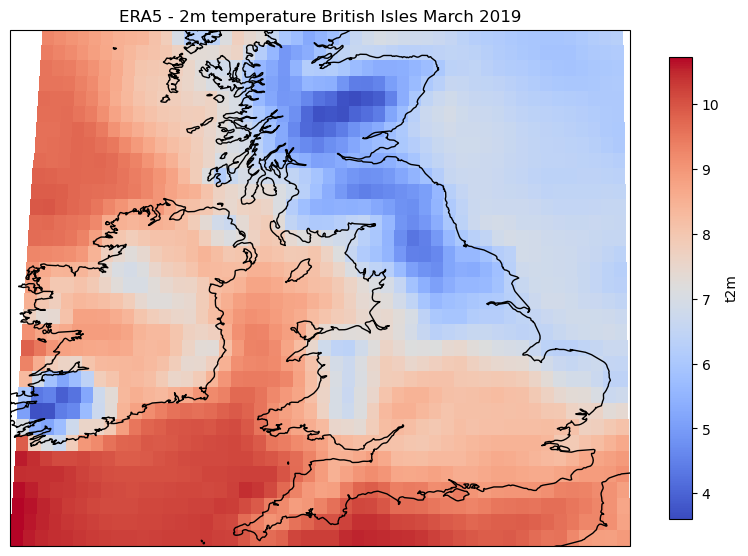
With CartoPy, we can create a more detailed plot, using built-in shapefiles to help provide geographic context:
[4]:
import cartopy.crs as ccrs
import cartopy
fig = plt.figure(figsize=(10, 10))
ax = plt.axes(projection=ccrs.Robinson())
ax.coastlines(resolution="10m")
plot = ds.t2m[0].plot(
cmap=plt.cm.coolwarm, transform=ccrs.PlateCarree(), cbar_kwargs={"shrink": 0.6}
)
plt.title("ERA5 - 2m temperature British Isles March 2019")
---------------------------------------------------------------------------
NameError Traceback (most recent call last)
Cell In[4], line 7
5 ax = plt.axes(projection=ccrs.Robinson())
6 ax.coastlines(resolution="10m")
----> 7 plot = ds.t2m[0].plot(
8 cmap=plt.cm.coolwarm, transform=ccrs.PlateCarree(), cbar_kwargs={"shrink": 0.6}
9 )
10 plt.title("ERA5 - 2m temperature British Isles March 2019")
NameError: name 'ds' is not defined
/home/docs/checkouts/readthedocs.org/user_builds/xray/conda/latest/lib/python3.10/site-packages/cartopy/io/__init__.py:241: DownloadWarning: Downloading: https://naturalearth.s3.amazonaws.com/10m_physical/ne_10m_coastline.zip
warnings.warn(f'Downloading: {url}', DownloadWarning)

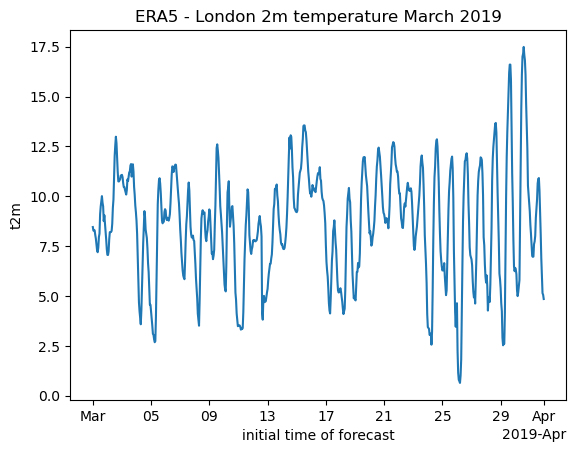
Finally, we can also pull out a time series for a given location easily:
[5]:
ds.t2m.sel(longitude=0, latitude=51.5).plot()
plt.title("ERA5 - London 2m temperature March 2019")
---------------------------------------------------------------------------
NameError Traceback (most recent call last)
Cell In[5], line 1
----> 1 ds.t2m.sel(longitude=0, latitude=51.5).plot()
2 plt.title("ERA5 - London 2m temperature March 2019")
NameError: name 'ds' is not defined